Welcome to a quick tour of BrandMap®
8.0!
This short tour emphasizes the ease of use of the BrandMap,
and cannot display all the features and options of either the
statistical or presentation aspects of the product. Please see
the BrandMap feature sheet and/or
call if there is any aspect of the product you would like to
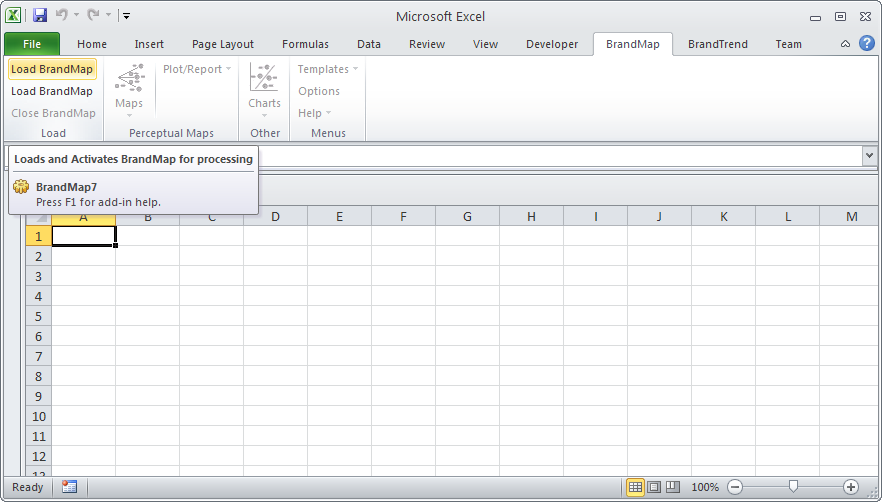
discuss! In Excel 2007 or 2010 you will find a BrandMap tab in
the ribbon interface. (In Excel 2003 you will find an Excel
toolbar which you can use to load the "Maps" menu.) To start BrandMap, select the "Load BrandMap"
button.
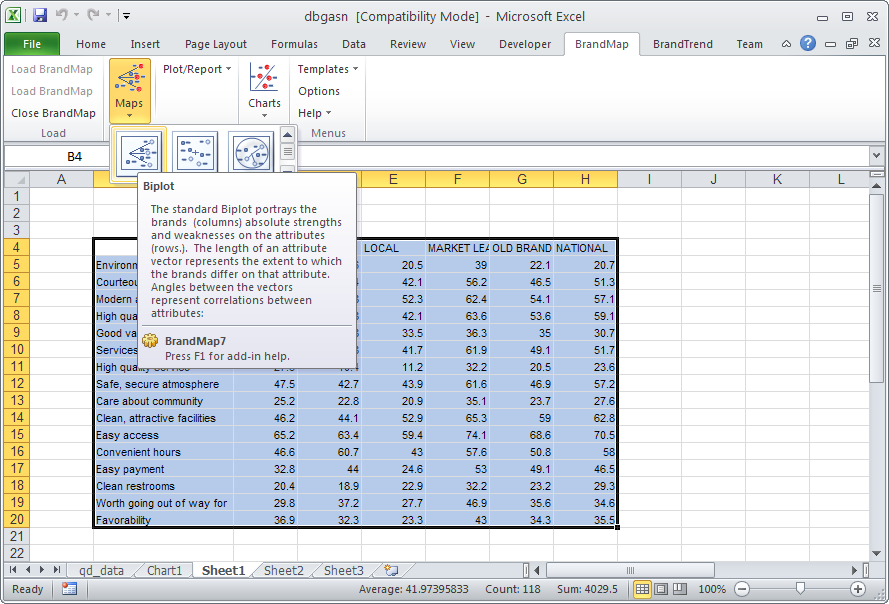
Since BrandMap 8.0 runs from inside Excel 2003, 2007, or 2010 data
can be easily pasted in, parsed in, or typed. To generate a map, just
highlight your table data (including labels) and select the type
of map desired. In our example, biplot is chosen...
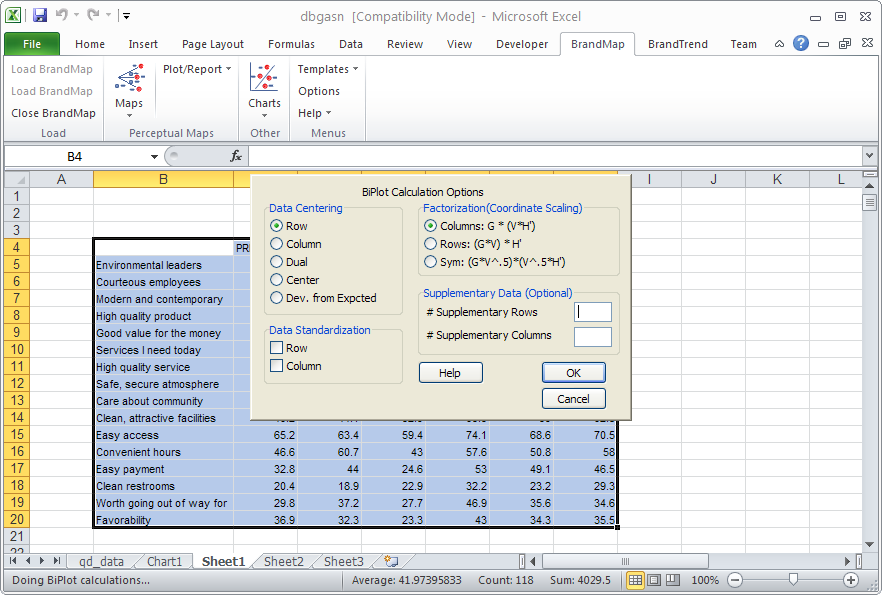
After choosing biplot, the following biplot options dialog
appears. We select the default options, and click on OK..
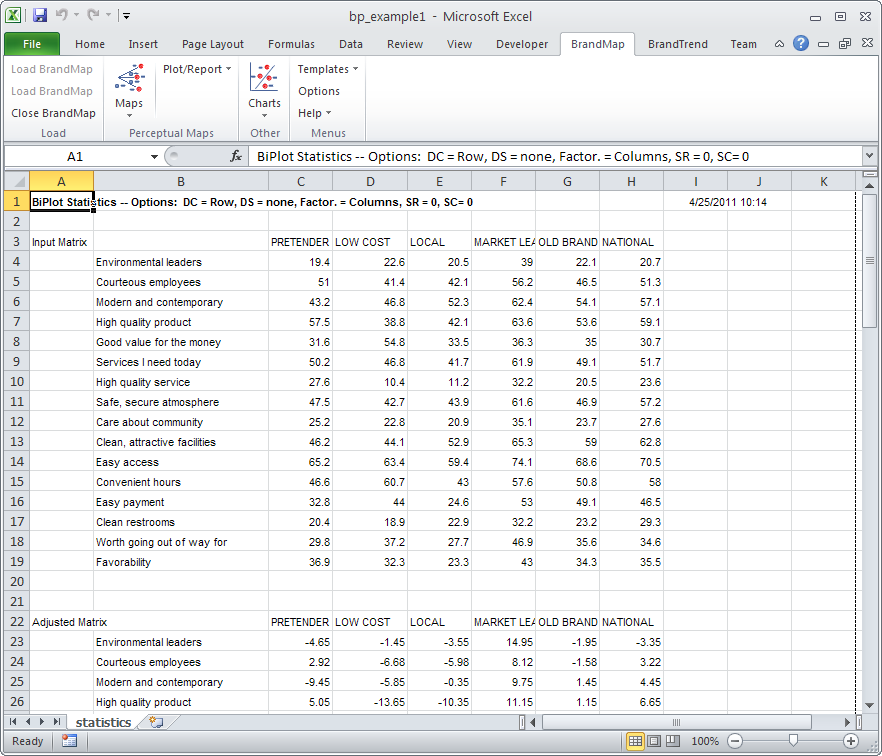
Because the BrandMap statistical routines run in compiled
code, we very rapidly get a complete set of statistics for our
analysis, including coordinates, correlations, and variance,
nicely presented in an Excel spreadsheet.
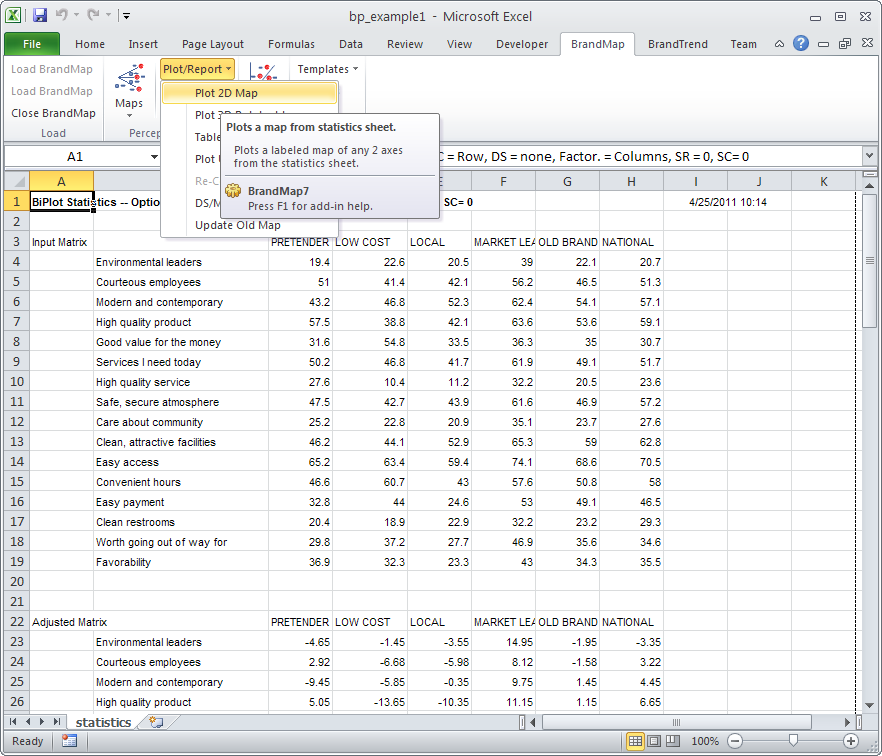
At this point, we are ready to look at a map. We select 'Plot
2D Map' from the Plot/Reports drop down menu...
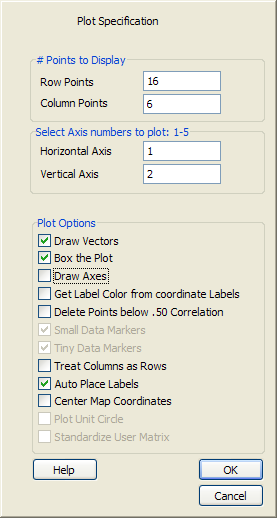
and get the Plot Specification Dialog Box. We select the
default suggestions of axis 1 & 2 and automatic label placement
and click on OK...
After filling in our titles in the Title Dialog, we rapidly
get the map, with labels automatically placed so as not to
overlap each other or the data points. Labels can be easily
moved, clicking on a data point highlights the corresponding
labels, all label characteristics can be changed individually or
globally, and text and graphic annotations can be easily added.
The map coordinates can be flipped or rotated...
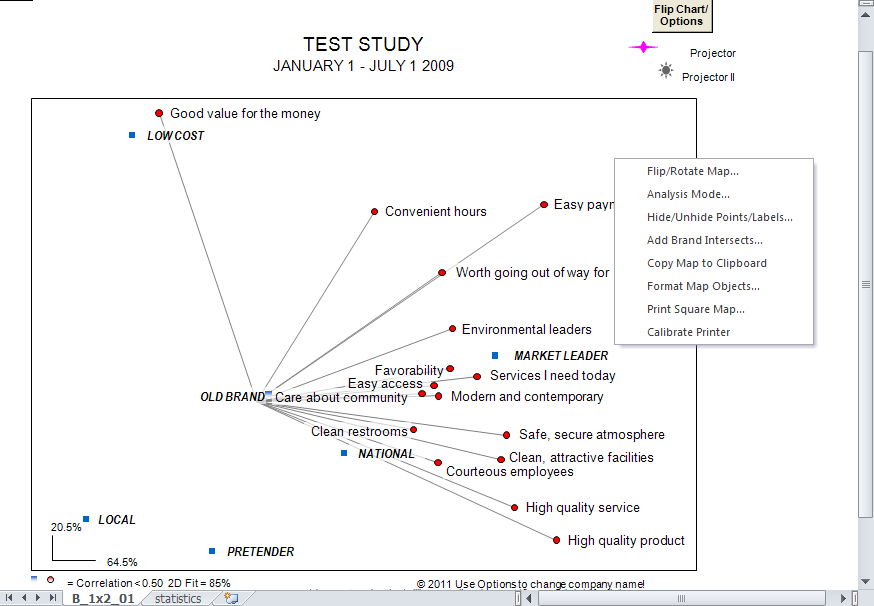
and the map can be printed to any Windows printer, or easily
pasted into other packages, such as PowerPoint. The image
above also shows the mouse "pop-up" menu which can be selected
with a left mouse button click while holding down the left shift
key.
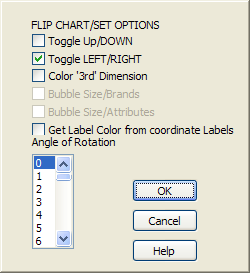
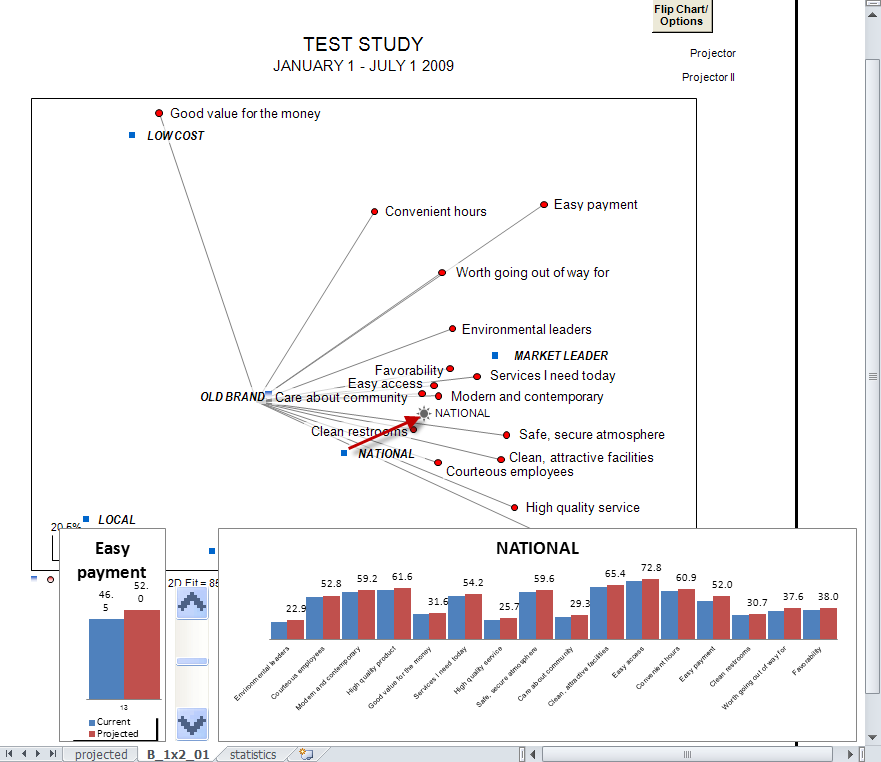
At this point in our analysis, we may want to know what
combination of image scores we would need to have to move a
brand to some particular point on the map, say closer to the
market leader. To do this, we simply drag the Brand Projector™
object (purple star below) to the desired spot and double click
on it..
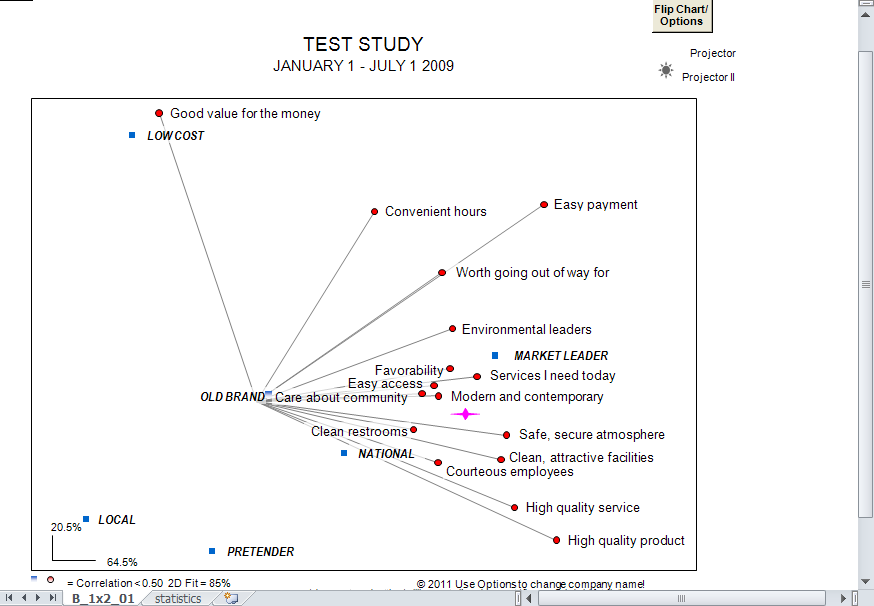
After selecting the brand we wish to 'Project', we get a
chart indicating the changes necessary to move to that point.
To use Brand Projector II, just click on the small star icon
and select both a brand and an attribute to change. A set of bar
charts appears below the map. By clicking on the UP/DOWN control
you can change the attribute and watch the brand move on the map
As you can see, BrandMap is an ideal program for rapid
(presentation ready) production and analysis of perceptual maps.
Correspondence, multiple correspondence, and mdpref maps are generated in the same manner,
and have all of the same capabilities, and their own appropriate
statistical options. BrandMap additionally allows for the direct
mapping of coordinates you may have from other procedures, and
provides a facility for automatic labeling and production of
quadrant charts (scatterplots).
|