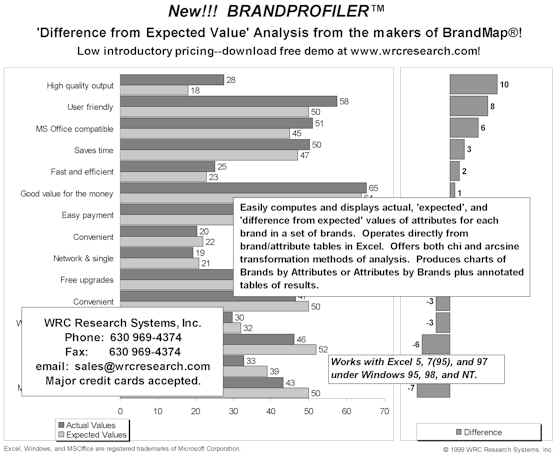
BrandProfiler™ easily computes and displays
actual, 'expected', and 'difference from expected' values of attributes for each brand in
a set of brands. BrandProfiler™ operates directly from brand/attribute tables
in Excel and offers both chi and arcsine transformation methods of analysis. It rapidly
produces presentation ready charts of Brands by Attributes or Attributes by Brands plus
annotated tables of results. BrandProfiler™ operates with Excel and is fully
MSOffice compatible. BrandProfiler™ easily computes and displays
actual, 'expected', and 'difference from expected' values of attributes for each brand in
a set of brands. BrandProfiler™ operates directly from brand/attribute tables
in Excel and offers both chi and arcsine transformation methods of analysis. It rapidly
produces presentation ready charts of Brands by Attributes or Attributes by Brands plus
annotated tables of results. BrandProfiler™ operates with Excel and is fully
MSOffice compatible.
· Presentation quality, report ready,
customizable charts in seconds.
· Point and click operation, fast computation
and plotting, handles large tables.
· Fast high quality output to laser and
color printers.
· Easy copy and paste into your word
processing documents.
· Easy data entry—the data matrices
(tables) can be entered by hand into the spreadsheet, imported from Quantum or other tab
packages, pasted in from other applications.
· Brand and attribute labels are
automatically applied. No need to re-enter them.
· Labels can be individually or
globally edited, bolded, underlined, italicized, boxed, etc.
Fonts, sizes and colors can be easily changed.
· Produces an annotated table of
differences indicating maximums and minimums.
· Extensive context sensitive on-line help
is always available.
Working within Excel, BrandProfiler provides for easy data access
or entry, fast calculation and presentation of charts. Just highlight your data table
(complete with labels) and BrandProfiler calculates the relevant statistics and produces
fully automatically labeled, presentation ready charts. There is extensive flexibility
provided both in terms of calculation options as well as in the graphical output.
BrandProfiler provides completely presentation ready output. (See
the image above for the BrandMap advertisement which was produced entirely with
BrandProfiler and Excel!) Excellent quality output is provided to laser and color
printers.
BrandProfiler displays the relative strengths and weaknesses of
brands on their attributes by mathematically determining the degree to which the brand
standings differ from expectations. The program automatically produces output of 1
chart per brand with bars for each attribute or 1 chart per attribute with bars for each
brand.
- Software Requirements
- Runs from within Excel 5.0, 7.0, or 97 under Windows 95, 98
and NT. (and therefore requires Excel and Windows!)
- Hardware Requirements
- PC with 486DX, Pentium or compatible.
- Capacities
- BrandProfiler capacities are substantial, but not
unlimited. The maximum number of columns varies by version of Excel:
- Excel 5.0 = 79 or 80.
- Excel 7.0 = 72
- Excel 8 (Office97) = 186
- Maximum rows are greater than 200 for all
versions, however correspondence map rows are equal to maximum number of columns. Excel 5
& 7 have an overall limit of about 5500 cells (rows x columns). Matrices of this size
for charting purposes are highly unusual, so BrandProfiler should be able to handle the
majority of tabled data that anyone might reasonably want to chart.
|