BrandMap� is the choice of professional
researchers worldwide for user friendly, rapid analysis and production of presentation
ready biplots, correspondence, and mdpref maps directly from highlighted
Excel tables. The exclusive Brand
Projector�
calculates and graphically displays the attribute changes necessary for
brand re-positioning to any point on a map. The new Version 5.0 features
true 3D rotatable maps and Brand Projector II�,
which allows a researcher to drag an attribute higher or lower while
watching the brand move on the map. BrandMap� operates with Excel and is
fully MSOffice compatible.
Brand Projector II: Watch the brand move on
the map as you 'adjust' the attribute scores.
3D Plots: View the 1st 3 dimensions of your
map at once with this rotatable labeled display.
Bubble Charts: Produce automatically labeled
bubble charts just as easily as quadrant charts.
Improvements
Easy hiding/unhiding of data points, vectors, and labels.
Easier to copy maps to other software.
"Size' bubbles can now be displayed around data points.
'Tiny' data points can now be displayed (as well as big and small).
The intercept charts produced in analysis mode for biplots are now
calibrated to the original attribute scores.
Biplots can now handle up to 500 rows.
New style BrandMap Help file.
BrandMap 5.0 manual now in Adobe PDF format.
Improved installation and registration procedures.
Improved error trapping and reporting.
Key Features
� Presentation quality, report ready,
customizable maps in seconds.
� Point and click operation, fast computation
and plotting, handles large matrices.
� Fast high quality output to laser and
color printers.
� Easy copy and paste into your word
processing documents (see examples!).
� Easy data entry—the data matrices
(tables) can be entered by hand into the spreadsheet, imported from Quantum or other tab
packages, pasted in from other applications.
� Brand and attribute labels are
automatically applied and located. No need to re-enter them.
� Labels can be individually or
globally edited, bolded, underlined, italicized, boxed, etc.
Fonts, sizes and colors can be easily changed.
� Clicking on a data point provides a visual
link to the appropriate label to aid in re-positioning labels.
� Easy hiding and un-hiding of data
points, labels, and vector lines.
� Clicking on a data point in analysis
mode on a vector chart instantly charts the brand intersections
on that attribute vector.
� Maps can be easily flipped or rotated
with just a click.
� Supporting statistics are reported—coordinates,
variance, correlations, inertias, ranks.
� All ‘data centering’ and factorization
options are provided.
� Supplemental rows/columns (passive data
points) are provided for correspondence maps, biplots, and mdpref maps.
� Any axes can be plotted, with
subsequent axes scaled in proportion to the first two.
� Vector lines can be optionally plotted
to the attribute data points.
� Extra text, circles, arrows, and other annotations
can be easily added to any map.
� Extensive context sensitive on-line help
is always available.
� Can directly map coordinates and labels
produced by other statistical procedures.
� Quadrant chart produces an
automatically labeled scatterplot of any 2 columns of numbers. Labels are placed to
not overlap data points or other labels.
 BrandMap provides major gains in productivity compared to
non-integrated approaches to producing perceptual maps and quadrant charts. Working within
Excel, BrandMap provides for easy data access or entry, fast calculation and presentation
of statistics, and rapid graphical production of maps and charts. Just highlight your data
table (complete with labels) and BrandMap calculates the relevant statistics and produces
fully automatically labeled, presentation ready perceptual maps. There is extensive
flexibility provided both in terms of statistical options as well as in the graphical
presentation. BrandMap provides major gains in productivity compared to
non-integrated approaches to producing perceptual maps and quadrant charts. Working within
Excel, BrandMap provides for easy data access or entry, fast calculation and presentation
of statistics, and rapid graphical production of maps and charts. Just highlight your data
table (complete with labels) and BrandMap calculates the relevant statistics and produces
fully automatically labeled, presentation ready perceptual maps. There is extensive
flexibility provided both in terms of statistical options as well as in the graphical
presentation.
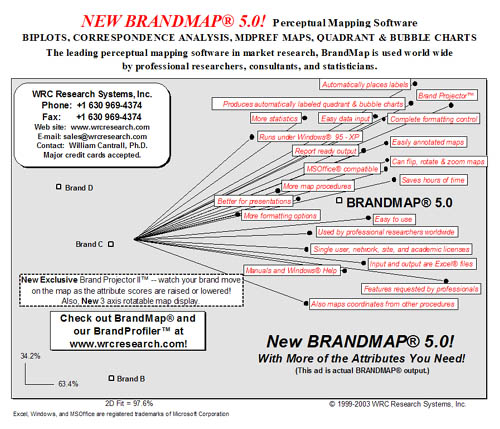
BrandMap provides completely presentation ready output and
extensive flexibility in terms of fonts, annotations, flips, and rotations. (See the image
above for the BrandMap advertisement which was produced entirely with BrandMap and Excel!)
Excellent quality output is provided to laser and color printers. Also provided is an easy
to use procedure for copying your BrandMap into presentation packages such as PowerPoint.
Data point labels are automatically placed so as to not overlap and can be easily placed
manually as well. Also, clicking on a data point highlights its label! Extra text, arrows,
boxes, circles, etc. can be easily added.
The rapid, interactive nature of BrandMap makes it possible to take
several different looks at your data in a very short time. You can easily try different
mapping techniques or options and visually compare the maps of your data. Clicking on a
data point in analysis mode on a vector chart instantly charts the brand intersections on
that attribute vector. The exclusive
Brand Projector™ calculates and graphically displays the attribute changes necessary
for brand re-positioning to any point on a map. The Brand Projector™ object is just
moved via mouse to a point on the map. Clicking on the object allows you to select the
brand (column point) you would like to move there, and then a chart of attribute changes
is immediately generated.
The new Version 5.0 features true 3D rotatable maps and Brand Projector II�,
which allows a researcher to drag an attribute higher or lower while
watching the brand move on the map.
Supplementary (or passive) rows and columns can
be plotted on correspondence maps, biplots, and mdpref maps.
- Software Requirements
- Note! Version 5.0 requires 2000 or XP, Windows 98,
NT, 2000 or XP.
- Hardware Requirements
- Pentium or compatible.
- Capacities
- BrandMap capacities are substantial, but not
unlimited. The maximum number of columns varies by version of Excel:
- Maximum rows are greater than
400 for all versions, however correspondence map rows are equal to maximum
number of columns. BrandMap can handle the majority
of tabled data that anyone might reasonably want to map.
- Correspondence Analysis
- Supports supplemental (passive) rows and
columns, 4 different factorizations, Brand Projector™.
Statistics: produces inertias, coordinates, variance, and correlations.
- Biplots
- Supports supplemental (passive) rows and
columns, 3 different factorizations, all data centering and standardizing options, Brand
Projector 1™ and Brand Projector II™. Statistics: produces coordinates, variance, and correlations.
- Mdpref
- Supports supplemental (passive) rows and
columns, Brand Projector™. Statistics: produces coordinates,
variance, and correlations.
- Brand Projector 1™
- Calculates and graphically displays the attribute
changes necessary for brand re-positioning to any point on a map.
- Brand Projector II™
- Allows a researcher to drag an
attribute higher or lower while watching the brand move on the map.
- Quadrant/Bubble Charts
- Automatically applies non-interfering row labels
to data points displayed in an Excel scatterplot or bubble chart. An
updating feature
allows for easy generation of a series of identically formatted charts with different data
in each.
- Vector Overlay
- Applies attribute vectors from a correlation
matrix (brand x attribute) to brand data points from MDS or discriminant procedures.
|