WRC Explorer
 |
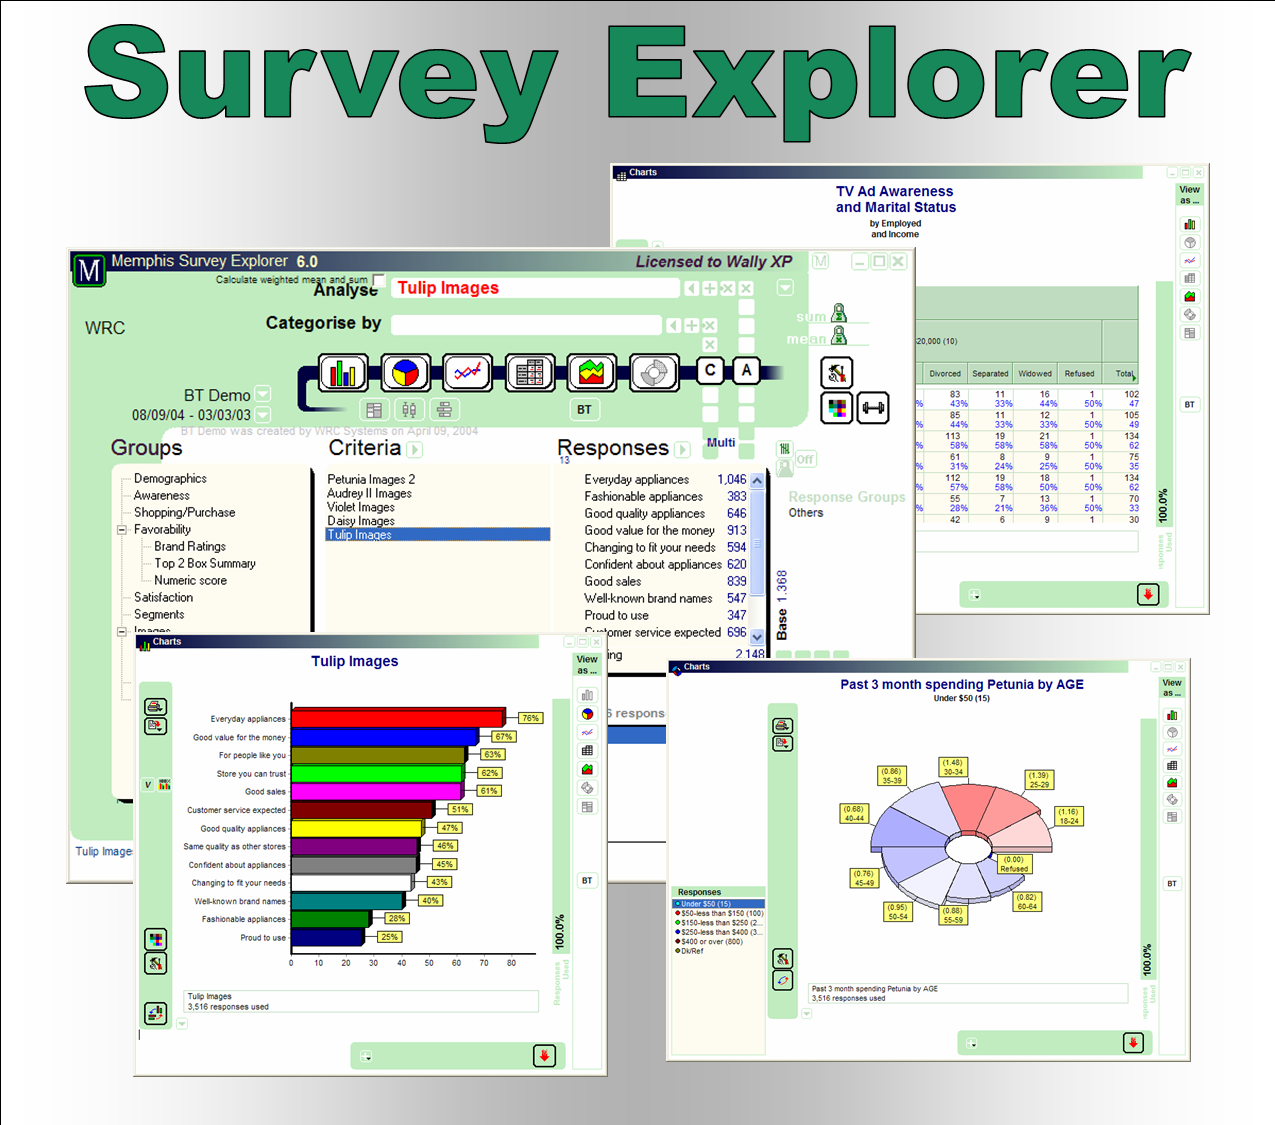
Survey
Information Delivery and Analysis System |
|
Finally,
advanced, interactive, full
featured cross tabs and charts from all of your survey
data can be at your fingertips. Survey Explorer™
is now available from WRC Research Systems to provide
you with the most advanced crosstab and charting
software system available. Survey Explorer provides both
amazing speed and unbeatable ease of use.
Please
contact us to set up a web demo and discussion of your
needs. |
|
Play
Demo: Survey Explorer Video |
|
|
|
|
|
|
Take advantage of the new 2009 pricing for Survey
Explorer! The developers of Survey Explorer are
lowering their prices on unlimited licenses for both
you and
your clients. This is your chance to equip all of your users and
clients with an advanced desktop analytical and
reporting tool at an unbeatable price. |
|
|
Features |
-
Specifically designed
as a client delivery system for
access and analysis of survey data
-
Equally appropriate for internal
analysis and reporting of survey data
- NEW
Windows Vista and Office 2007 compatible
- NEW
Analysis of hierarchical (Levels) data
- NEW
Queries/Views can be saved in multiple files and
shared
- Define and save
default colors for chart bars, etc.
- Unlimited number
of records, waves, and variables
- Colorful, intuitive interface
- Controls
highlight with mouse flyover—‘Hints’ display on
all controls with mouse stop
- Many charts or
tables can be open on the
screen at once to facilitate analysis
- Variables can be
logically organized in a tree view
- Quick swap
between surveys
- Simple definition
of queries
- Grouping
(ungrouping and re-grouping) responses
- Criteria
(Question text) Search function
- Criteria
(Response text) Search function
- Display of
response counts
- Analysis of
responses by a single criterion or several
criteria on the same chart
- Color Picker
(defining the color for a particular response in
all charts)
- Adding weights to
responses
- Easy definition
of filters (including the AND, OR and NOT
functions)
- Saving and
re-using filters
- Controlling
values displayed on charts (actual values, % of
group, % of legend)
- Survey Explorer
with your company logo
- Save individual
queries, which automatically update when new data
(e.g. another wave) is added
- Unique features
for wave studies--new or changed responses or
questions are automatically handled
- Straight forward
input of data from many data formats and file
types
- Multiple
response, single response, scales, integer,
floating point data easily accommodated and
appropriately analyzed
- The current list
of compatible formats includes Triple-S, SPSS,
Merlin, Quancept, Quantum and SurveyCraft, as well
as Excel worksheets and tab-delimited files. New
formats are being added regularly upon request.
Charts and tables:
- Hide/unhide entire groups in charts
- Bar, Pie, Line,
Area charts
- One button switch
between chart types
- One button switch
between chart and table view
- Instantly
re-arrange tables by dragging nested criteria
- Compass diagrams
with indices
- “Box-and-Whisker”
Diagrams
- Secure chart sharing/editing
capabilities between users on a network
- Chart
customization (legend position, title, additional
text, switching axis)
- Cross-table
options (including hot-swapping axis)
- Ability to rotate
Pie Charts and explode or hide segments
- 2D to 3D slide
control allows user to add perspective to all
charts
Reporting/Printing/Publishing:
- NEW
Batch printing in the Survey Viewer module
- NEW
Enhanced and improved export to spreadsheets
- NEW
Batch copying/updating of charts into PowerPoint
as native PowerPoint charts using your templates
- Move/delete slides in the Survey Viewer
- Black & White printing
- Previewing,
printing, and copying charts
- Print Preview
function (allows change of report colors, titles
etc)
- Print charts and
tables
- Copy to clipboard
function for all charts
- One step export
to Excel for all cross tables.
- Export of Charts
for use with the Survey Viewer
- Create, select
and save charts and tables to view in a slideshow
style presentation
Statistical reporting and testing:
- Optionally base
percentages as either all responders to question
or just those responding to the responses you
select
- T-Test with overlap
- Ability to assign
different respondent weights to specific columns
of a table
- Printing of
statistics
- Multiple "base"
definitions within a question
- Percentages
calculated from a particular cell in a table
- Sums and means
visible on same table
- Significance
testing (test of proportions and Chi Square)
- Both horizontal and vertical bar charts with both
dependant and independent variables
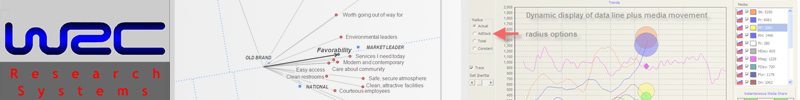
BrandTrend:
- Uniquely
integrated with
BrandTrend for advanced trend chart analysis
of your continuous or wave studies with the
ability to integrate media, marketing and sales
data
|
|
|