Welcome to WRC Research Systems!
-
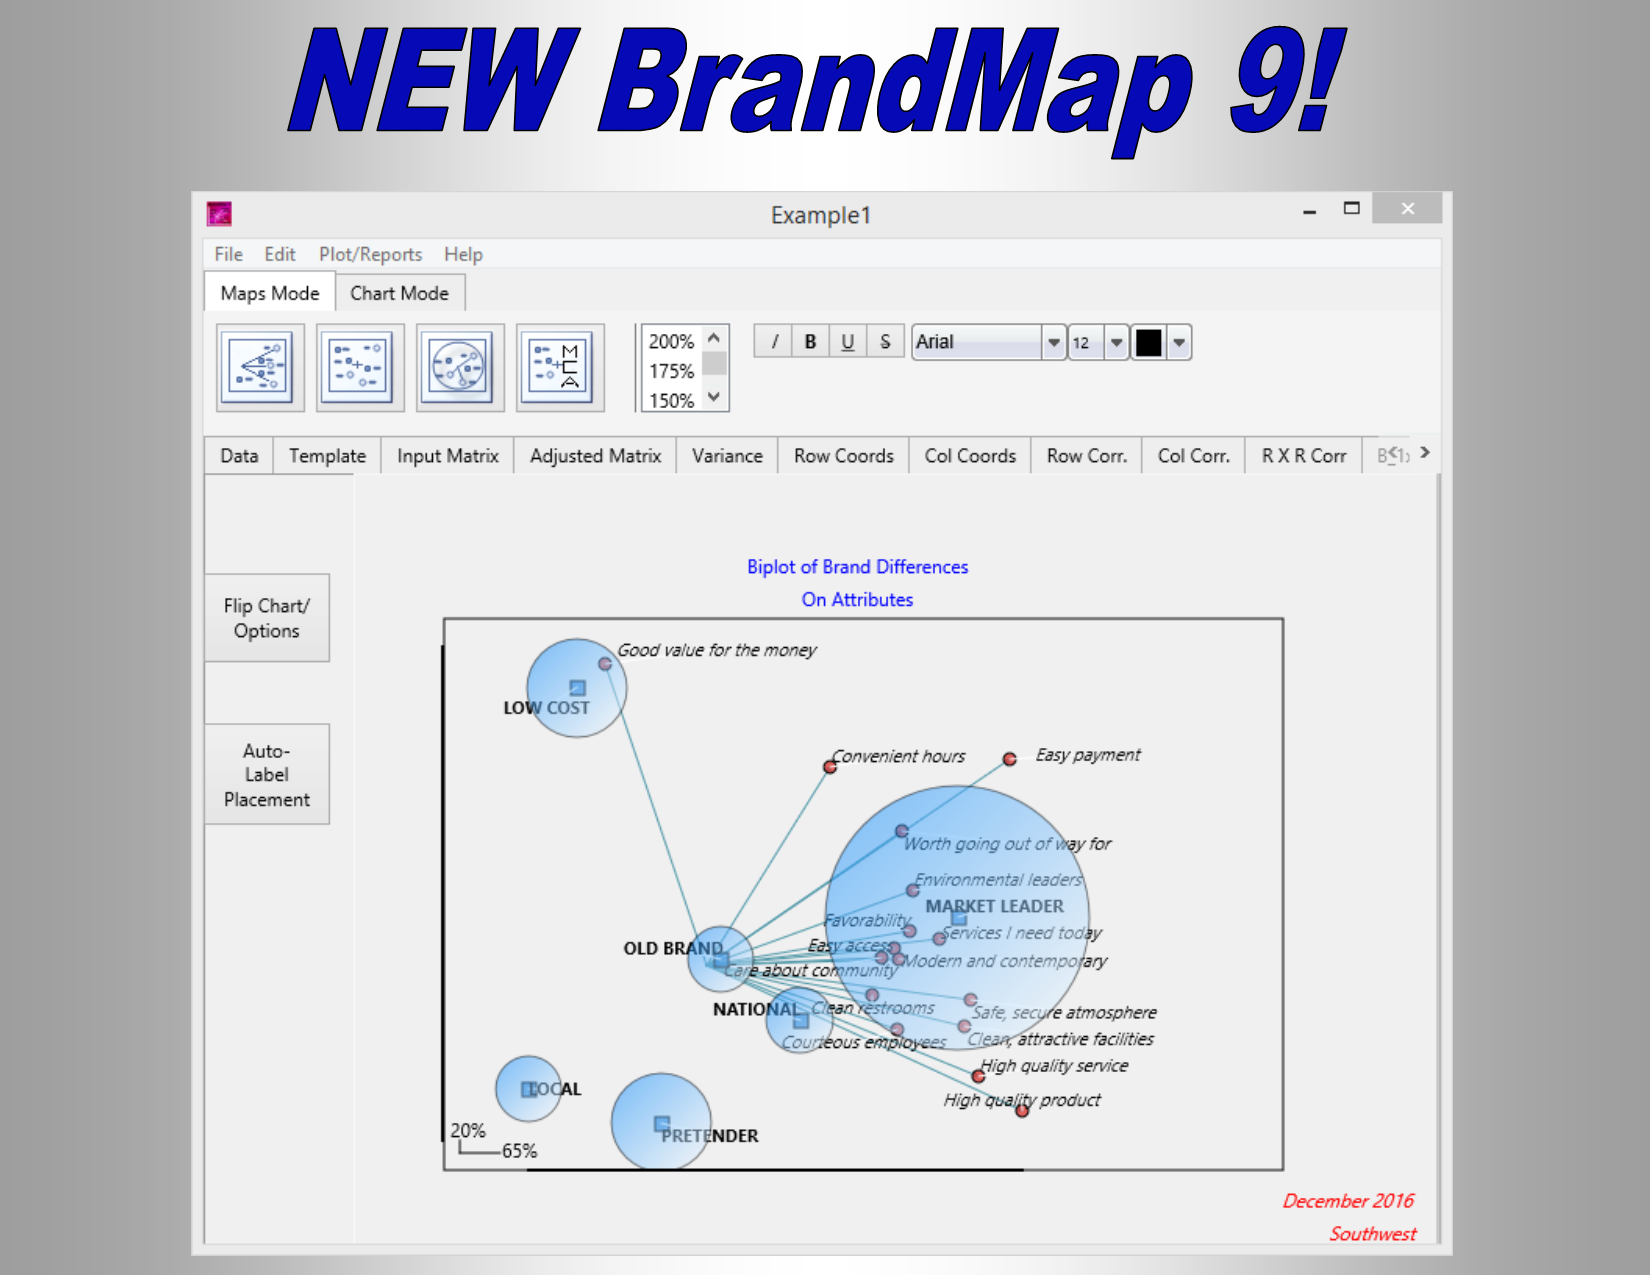
New BrandMap® 10!
- Produces presentation ready biplots, correspondence maps, mdpref and MCA maps in seconds right from your tables
- Exclusive Brand Projectors I & II provide interactive “what if” analysis right on the map
- New 64 bit program for PCs and MACs
- Windows 7 -10 and recent MAC OS-X compatible
- The choice of professional researchers worldwide
- Both single copy and Enterprise licensing available!
- More Information and Feature List
Trend your
Excel data!
-
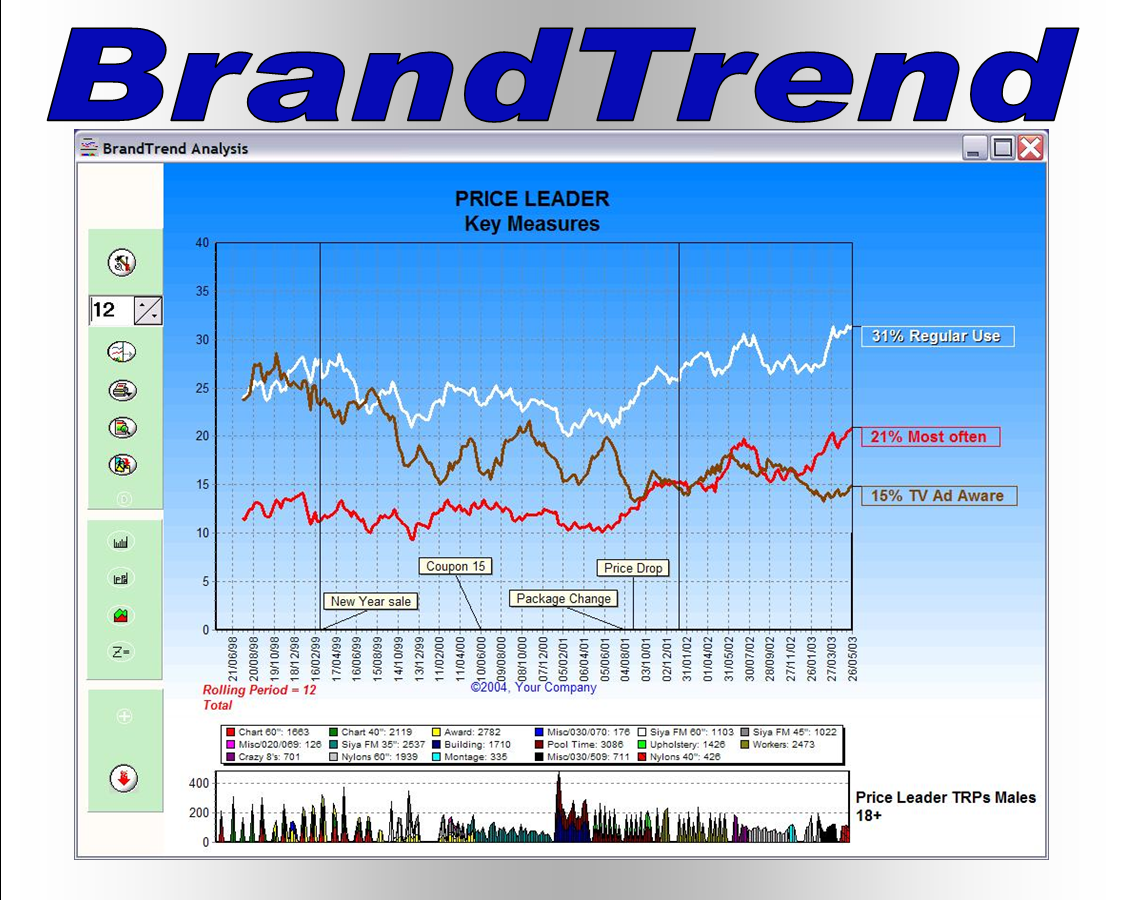
New BrandTrend XL!
- Trend any and all measures along with your media and marketing activity right from within Excel
- Scroll through time using dynamic visualization to see the effect of your executions on your trend measures
- Zoom in on periods of interest to determine which executions or activities are affecting your trends
- More Information and Feature List
-
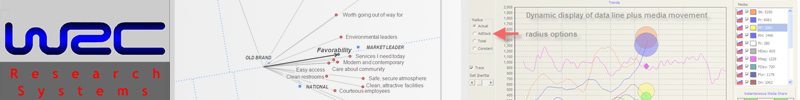
BrandTrend® DM
- Visually analyze the impact of your media and marketing activities on awareness, brand image, and all other variables
- The most advanced trend charting system available today for internal analysis and client delivery
- Provides an ideal desktop interface for viewing and analyzing trend charts
- Attaches directly to any Dimensions dataset to facilitate the analysis and processing of survey data results via trend charts for tracking studies
- Provides for easy integration of your media, marketing and sales data on the chart
- More Information and Feature List
- To Play Demo click: BrandTrend Video