Biplot Interpretation
Vector Interpretation of Maps
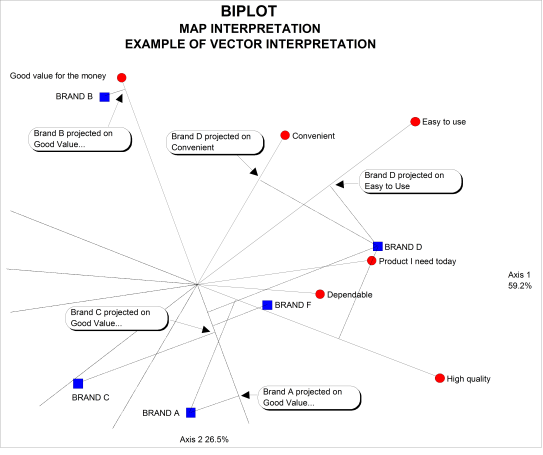
In the above biplot, the relative standing of brands on an attribute can be determined by drawing a perpendicular line from the attribute vector line (or its extension on the other side of the origin) to each of the brands (refer to map above for examples). In the example, the attribute vector "Good Value for the money" extends to the upper left. Regard the lines projected from the brands to that vector line. Brand B is highest, followed by Brand D, Brand F, Brand C, and finally, Brand A.
The center of the map, where the axes intersect, represents the overall mean of each attribute, and is the center around which the brands are dispersed.
The length of an attribute vector represents the extent to which the brands differ on that attribute. In the above example, there is more difference between the brands on "Good value..." than there is on "Dependable." (On the "default" BiPlot the length is equal to the standard deviation of the brands).
Angles between the vectors represent correlations between attributes: 90 degree angles = 0 correlations, angles < 90 represent positive correlations, and angles > 90 represent negative correlations. In the above example, "High quality" is positively correlated with "Dependable" and negatively correlated with "Good value..." Also, attributes showing small angles with one of the axes will be highly correlated with that axis, (e.g. "Dependable" and Axis 1). A correlation of less than 0.50 with the combination of the two axes displayed, means that the attribute or brand in question is really lying more out of the plane of the two axes than in it.
Summary:
The center of a map represents the average for each attribute. The line for an attribute points in the direction of higher scores on that characteristic. The length of the line represents the extent to which the brands are perceived as different on that attribute. The longest lines indicate the attributes on which the brands differ most.
Those brands that are similar across most characteristics appear close together in the map, brands which are very different appear far apart. Generally, a brand scores relatively well on those attributes that point toward it, and less well on those pointing away.
Note: If the data which makes up the table represents respondent perceptions, then the map should be interpreted as a reflection of those perceptions (hence the term, "perceptual mapping") rather than as an reflection of "real" brand differences. Additionally, if your columns and rows do not represent Brands and Attributes, just substitute what they do represent into the above discussion.
Copyright © 1994 - 2017 WRC Research Systems, Inc.
Still need help? Please email us with any questions .